Dashboard for real-time KPIs from production
Providing goods and services efficiently and finding the best solution for each customer: Using this formula for success, Continental has transformed itself in its almost 150 years of company history from being a tire manufacturer to becoming one of the largest automotive suppliers in the world. The "value of use" of the products offered is an important benchmark for the listed company – and it is also applied to its own tools.
.
Usability in electrical engineering
Transparency and clarity are essential to illustrate production processes and ensure success monitoring. This also applies to the representation of electronic components used at Continental’s Electronic Engineering and Manufacturing: Every year, thousands of different components, such as microcontroller, memory chips and more are introduced in this Electronic Library. When we first began our joint collaboration, an Excel application served as the data basis for the evaluation of internal processes. Together with the customer, we developed a customized solution with excellent usability. Built on a modern technological basis, it was named the Electronic Component Creation Monitoring.

Real-time forecasts
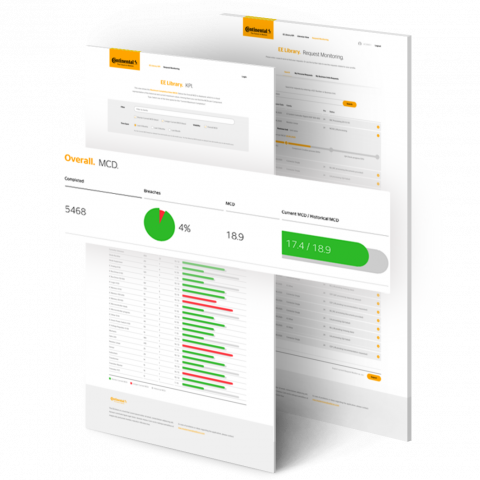
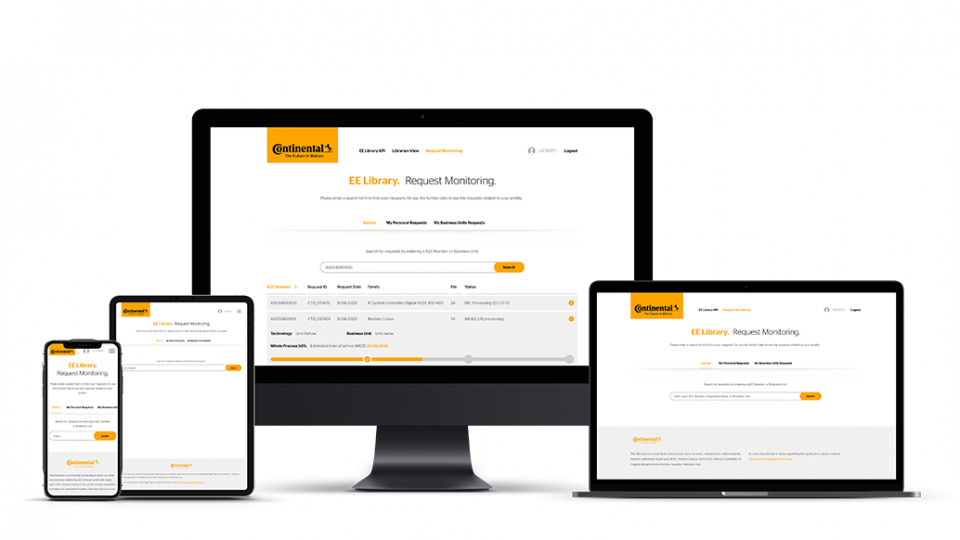
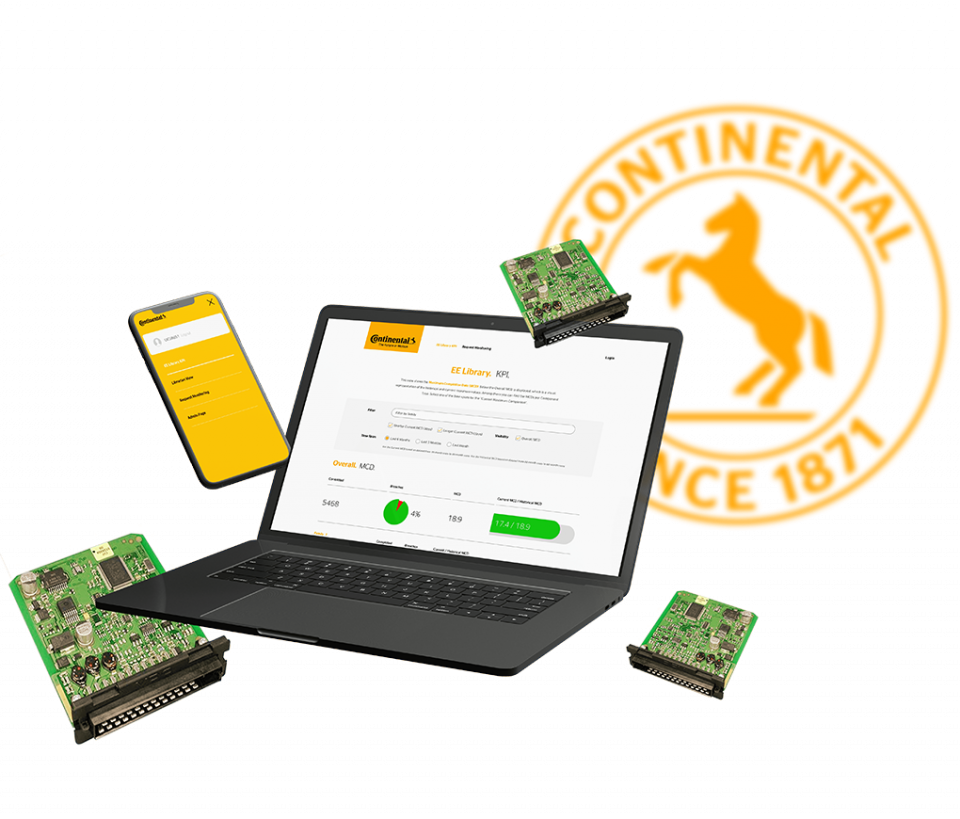
Instead of the cumbersome tabular view, Continental now uses worldwide a tool for monitoring the component creation status and forecasting the delivery date. Used on desktop computers, mobile devices and large screens, the Electronic Component Creation Monitoring displays the current status and progress including expected delivery date in real time via a dashboard. To do so, it shows past and current average turn-around time. The Electronic Component Creation Monitoring provides access to key performance indicators (KPIs), such as component and component family lead times, making it easier for management to interpret results and identify trends and to be able to take action.

Valuable insights through data visualization
As a business intelligence solution for product development, the Electronic Component Creation Monitoring demonstrates the added-value use of web technology in combination with consistent UX design. The visualization of relevant data with the help of an easy-to-use tool simplifies work processes and thus provides the company with a competitive advantage.


real-time monitoring tool for production KPIs
desktop computers, smartphones, tablets, factory displays
agile development process with focus on UX